
Introduction:
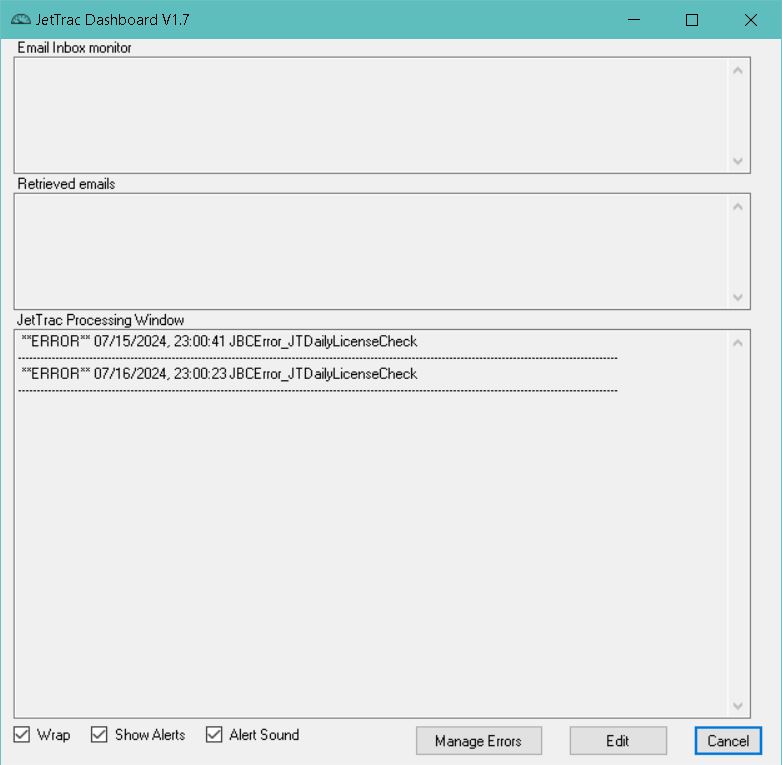
JT Dashboard Main Window
Graphical interface to production processing in JetTrac JobController.
Technical Support:
If you need assistance in installing and configuring JetTrac Dashboard™, call Pro Technology Automation, Inc. at 805-527-1248 or email us at support@protechinc.com. Please note that the JetTrac Dashboard™ license fee does not cover configuration services and technical support so there may be an additional charge. Please ensure you read these instructions carefully before calling for technical support.
How to Run:
To run this program you need these files in the same folder:
- JTDashboard.exe
- JTDashboard.bat
- JTDashboard.ini
- Exithandler.dll
Executable files and dll files should not be edited for any reason.
Default Functionality:
For a non-technical user to be able to see what JetTrac is processing in a very user friendly way.
The GUI contains three panes which display logs useful when monitoring the status of the JetTrac jobs running on your server. The three panes are:
Email Inbox Monitor - This pane shows a log of the emails received in a Gmail account. Please note that JTGmailMonitor is required to be running as a service for this to display any data.
Retrieved Emails - This pane displays the log for the JTPOP3Scanner which picks up email attachments sent to a configured watched email address.
JetTrac Processing Window - This pane displays important information on the JetTrac jobs running on your server. It is here that you can find jobs that process correctly as well as jobs that error out.
Beneath the three log panes there are three checkboxes:
Wrap - This checkbox when enabled will wrap text in a single line to the next line instead of having to scroll to the left or right to see the entire line.
Show Alerts - When enabled this checkbox will display an alert pop-up window when a line containing the AlertTag (configured in the Config INI file below) is brought into the Dashboard. Typically this AlertTag is set to ERROR so that it will alert when an error occurs.
Alert Sound - When enabled this checkbox will cause a alert sound to play when an alert pop-up window comes up.
Next to the checkboxes you will see three buttons:
Manage Errors -Clicking this button will open up a separate window used to view and reprocess errors. Information on this window can be found below in the Manage Errors section.
Edit - Will open up the archived log file within your default text editor.
Cancel - This button closes Dashboard.
Manage Errors:
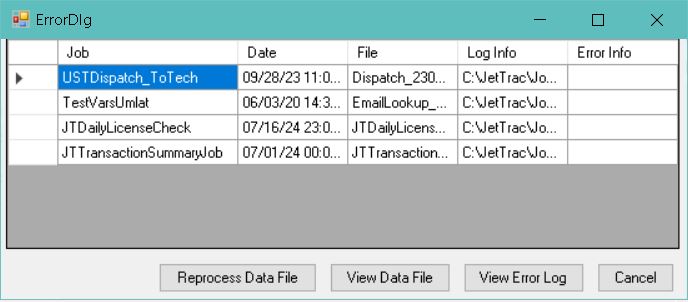
Within the manage errors window you will see a table listing each error found within the Error folder. Specifically, an error will display here if a .err file is found in the error folder and an associated JBCError XML file is found within the Archive folder.
You can select a line within the table by clicking to the left of the Job column on the row. If done correctly you will see the entire line highlight in blue. You can then use the Reprocess Data File, View Data File, and View Error Log buttons on the bottom of the window for that line.
Button Functionality:
Refresh - Clicking this button will refresh the table, retrieving any errors that may have occurred while this window has been open. The window will also refresh automatically every time it is opened and whenever a data file is reprocessed.
Reprocess Data File - Clicking this button will take the original input file for the error, copy it to the Data folder to attempt to process it again as well as deleting the error files for this error.
View Data File - Clicking on this will open the original input data file in the default program for that file type (ex: Notepad++ for XML, Acrobat for PDF, etc.).
View Error Log - This button will open the error log file for the error in question, providing more information on the error.
Cancel - Click this to close out of the ErrorDlg window.
Command Line:
"C:\JTDashboard.exe" "C:\JTDashboard.ini" "C:\JTDashboard.log"
The command line is the fully qualified path to the program's executable file followed by the path to the config.ini file and ends with the log file.
Config File:
QueFile=C:\JetTrac\JobController\Server\Log\QueueFile.log
ArchiveFile=C:\JetTrac\JobController\Server\Log\Dashboard.archive
EditorExe=C:\Program Files (x86)\Notepad++\notepad++.exe
AlertTag=ERROR
MaxSize=5000
JobController=C:\JetTrac
TextViewer=C:\Program Files (x86)\Notepad++\notepad++.exe
QueFile=The fully qualified file path to the queue file saved by JTLog.
ArchiveFile=The fully qualified file path to the archive file.
EditorExe=The fully qualified file path to a text editor installed to your PC. We recommend using Notepad++.
AlertTag=A string present within the log that you wish to set an alert for. Typically this stays set as ERROR.
MaxSize=The max number of lines to display.
JobController=The path to the JetTrac folder on the server.
TextViewer=The fully qualified file path to the text viewing application you wish to use. We recommend installing and using Notepad++.